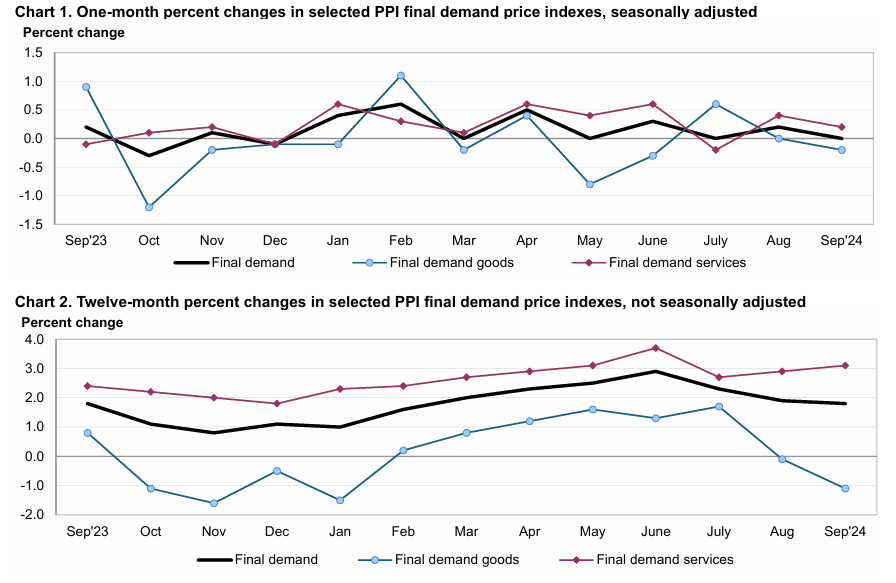
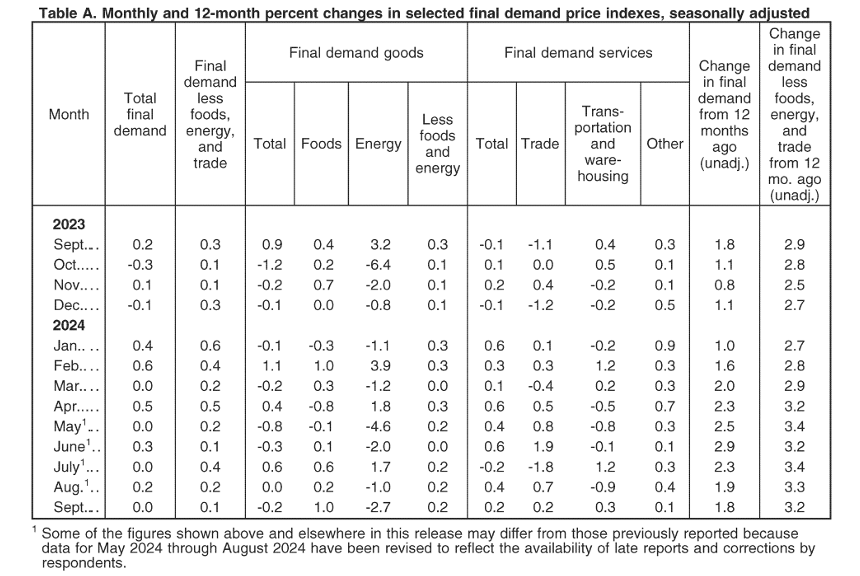
The Producer Price Index (PPI) reported that final demand prices advanced 0.2 percent in August and were unchanged in July. On an unadjusted basis, the index for final demand rose 1.8 percent for the 12 months ended in September.
Within final demand in September, a 0.2 percent increase in the index for final demand services offset a 0.2 percent decline in prices for final demand goods.
The index for final demand less foods, energy, and trade services inched up 0.1 percent in September after rising 0.2 percent in August. For the 12 months ended in September, prices for final demand less foods, energy, and trade services increased 3.2 percent.
Final demand for goods versus services can be found in the graphic below.

The index for final demand goods decreased 0.2 percent in September following no change in August. The decline can be traced to a 2.7-percent drop in prices for final demand energy. In contrast, the indexes for final demand foods and for final demand goods less foods and energy increased 1.0 percent and 0.2 percent, respectively.
Leading the September decline in prices for final demand goods, the index for gasoline decreased 5.6 percent. Prices for diesel fuel, jet fuel, chicken eggs, home heating oil, and plastic resins and materials also fell. Conversely, the index for processed poultry jumped 8.8 percent. Prices for electric power and for motor vehicles also moved higher.
Further details on the final demand price changes can be found in the chart below:

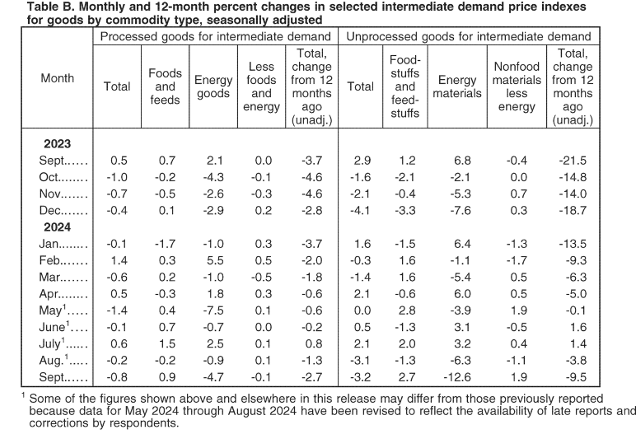
Within intermediate demand in September, prices for processed goods declined 0.8 percent, the index for unprocessed goods fell 3.2 percent, and prices for services moved up 0.2 percent.
The index for processed goods for intermediate demand moved down 0.8 percent in September, the largest decline since falling 1.4 percent in May. Most of the September decrease is attributable to prices for processed energy goods, which dropped 4.7 percent. The index for processed materials less foods and energy edged down 0.1 percent. In contrast, prices for processed foods and feeds rose 0.9 percent. For the 12 months ended in September, the index for processed goods for intermediate demand decreased 2.7 percent, the largest 12-month decline since falling 3.7 percent in January.
The index for unprocessed goods for intermediate demand moved down 3.2 percent in September, the largest decline since falling 4.1 percent in December 2023. The September decrease is attributable to prices for unprocessed energy materials, which dropped 12.6 percent. In contrast, the indexes for unprocessed foodstuffs and feedstuffs and for unprocessed nonfood materials less energy increased 2.7 percent and 1.9 percent, respectively. For the 12 months ended in September, prices for unprocessed goods for intermediate demand fell 9.5 percent, the largest 12-month decline since decreasing 13.5 percent in January.
Further information can be found in the chart below:

The full October 2024 Producer Price Index can be found here.

