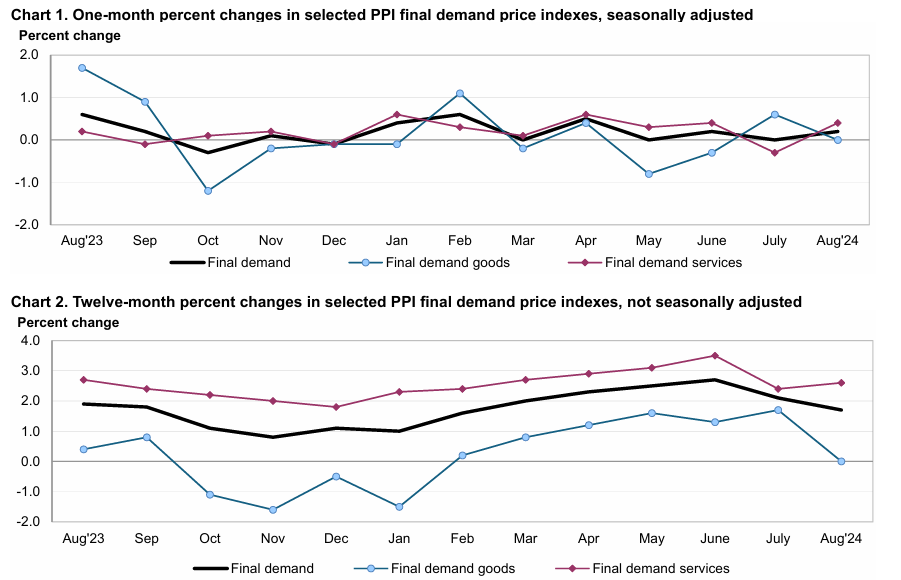
The Producer Price Index (PPI) rose 0.2 percent in August and 1.7 percent over the past twelve months. The August rise in the index for final demand can be traced to a 0.4-percent increase in prices for final demand services. The index for final demand goods was unchanged.
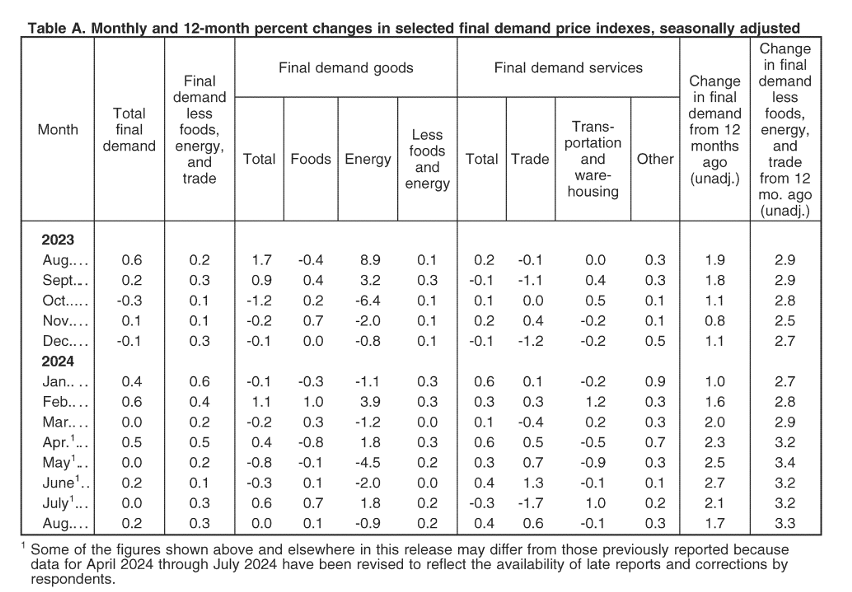
Prices for final demand less foods, energy, and trade services advanced 0.3 percent in August, the same as in July. For the 12 months that ended in August, the index for final demand less foods, energy, and trade services moved up 3.3 percent.
Final demand for goods versus services can be found in the graphic below.

Prices for final demand goods were unchanged in August after rising 0.6 percent in July. In August, the indexes for final demand goods less foods and energy and for final demand foods advanced 0.2 percent and 0.1 percent, respectively. In contrast, prices for final demand energy fell 0.9 percent.
Further details on final demand price changes can be found in the chart below:

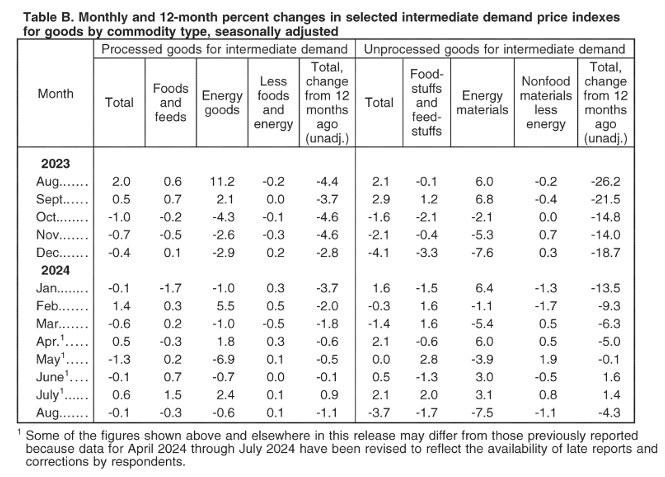
Within intermediate demand in August, prices for processed goods fell 0.1 percent, the index for unprocessed goods decreased 3.7 percent, and prices for services declined 0.1 percent.
The index for processed goods for intermediate demand moved down 0.1 percent in August after rising 0.6 percent in July. Leading the decrease, prices for processed energy goods declined 0.6 percent. The index for processed foods and feeds fell 0.3 percent. In contrast, prices for processed materials less foods and energy inched up 0.1 percent. For the 12 months ended in August, the index for processed goods for intermediate demand fell 1.1 percent, the largest decline since a 1.8-percent decrease for the 12 months ended in March.
The index for unprocessed goods for intermediate demand moved down 3.7 percent in August, the largest decline since falling 4.1 percent in December 2023. More than three-quarters of the broad-based decrease in August is attributable to a 7.5-percent drop in prices for unprocessed energy materials. The indexes for unprocessed foodstuffs and feedstuffs and for unprocessed nonfood materials less energy also moved down, 1.7 percent and 1.1 percent, respectively.
Further information can be found in the chart below:

The full September 2024 Producer Price Index can be found here.

