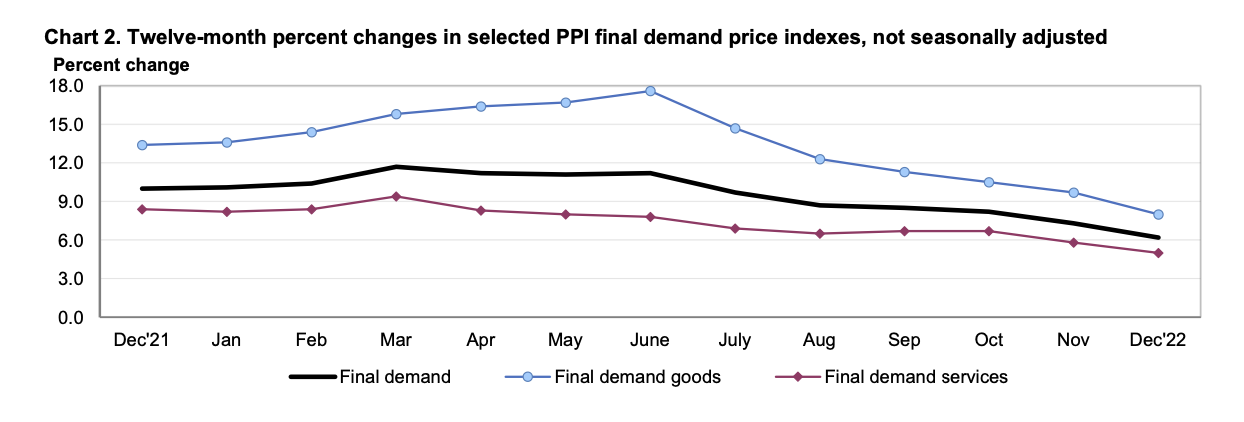
The Producer Price Index (PPI), which reflects what suppliers are charging businesses and other customers and is generally considered the core metric of input price changes, is up 6.2 percent year-over-year, according to the Department of Labor (DOL). That closely tracks the prices consumers are seeing, with the Consumer Price Index up 6.5 percent year-over-year.
The 6.2 percent year-over-year rise indicated in the December Producer Price Index, released by DOL on Wednesday, follows a 10 percent rise in the PPI in 2021, reflecting a historic increase in input prices over the last two years.
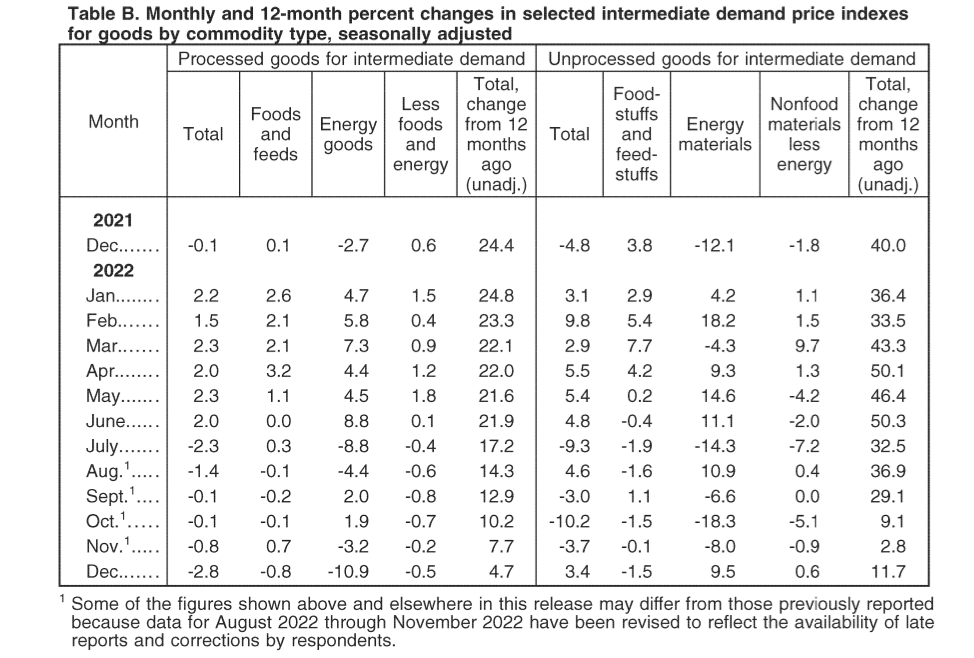
The Producer Price Index includes data on final demand and intermediate demand. Final-demand buyers include consumers, government, and foreigners, as well as domestic industries that purchase the commodity as capital investment. Intermediate demand buyers consist of domestic industries that purchase the commodity as an input to production, excluding capital investment.
The index also breaks down specific commodity categories (i.e. unprocessed foodstuffs and feedstuffs, processed fuels for manufacturing industries, supplies to non manufacturing industries/feeds, etc.) for final demand buyers as well as intermediate demand buyers.
Processed goods for intermediate demand decreased 2.8 percent in December, the largest decline since April 2020. Nearly two thirds of this decline can be traced to a 27 percent drop in prices for diesel fuel. Prepared poultry also dropped.
Unprocessed goods for intermediate demand rose 3.4 percent, largely due to the index for natural gas which surged 45.3 percent. Prices for ungraded chicken eggs increased.
Further information on intermediate demand price changes for processed and unprocessed goods can be found in the chart below, per DOL:
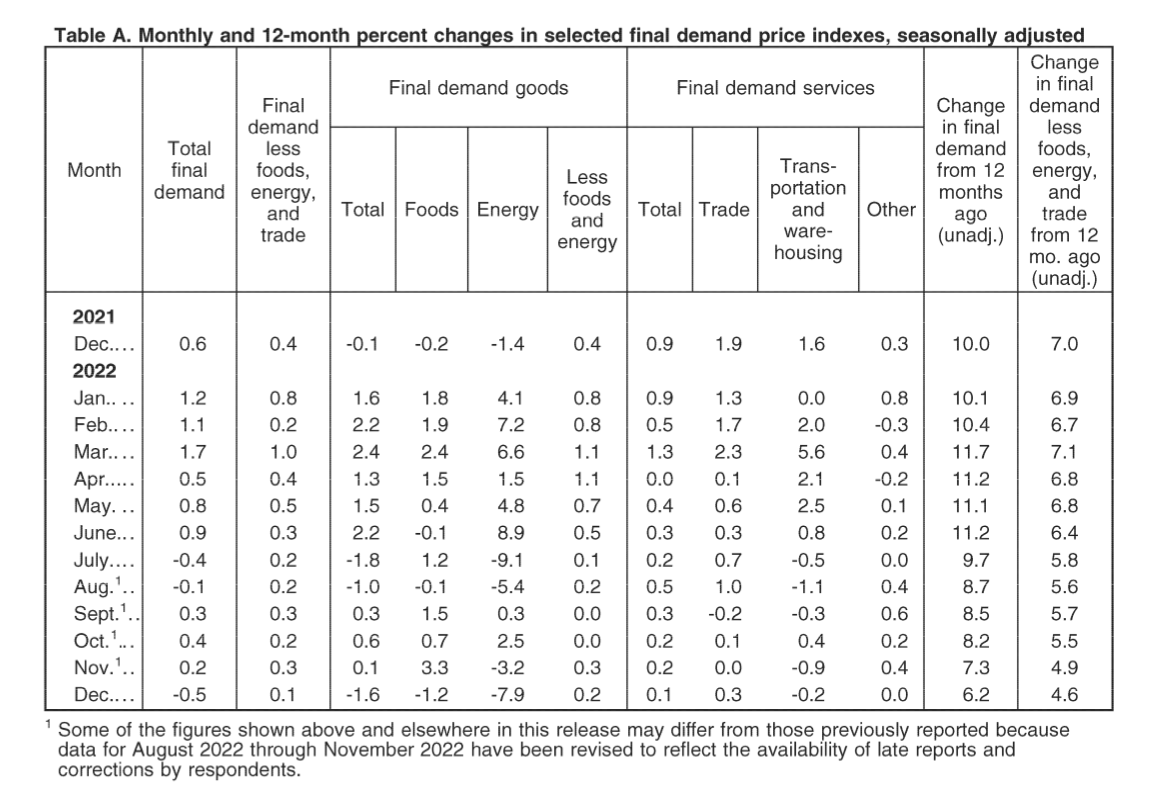
As for final demand, prices dropped 1.6 percent in December, the largest decrease since July. Energy led the drop in prices at 7.9 percent. Prices for final demand foods decreased 1.2 percent. The index for prepared poultry dropped, reflecting the drop in prepared poultry for intermediate demand mentioned above.
Finally, prices for final demand services rose 0.1 percent, primarily due to an increase in margins for fuel and lubricant retailing.
Further detail on final demand price changes can be found in the chart below:
The breakdown in final demand for goods versus services can be found in the graphic below.
More information can be found in the full index here. A DOL guide for interpretation of each category can be found here. The December Consumer Price Index can be found here.
