Although there were some relatively modest changes in 2011 in how often supermarkets price featured the top six chicken items, the ranking of the leading half-dozen items did not change from 2010, according to USDA data. The top six featured items were (national frequency of price featured item as a percentage share of total chicken features/average national feature price in dollars per pound): breast, boneless-skinless, regular pack-10.35/2.81; whole rotisserie chicken less than 2 pounds-8.04/5.62; fried chicken, eight-piece mixed-7.61/6.09; drumsticks, value pack-7.23/1.10; thighs, value pack-6.95/1.11; and whole bagged fryer-6.80/1.05. Interestingly, the top featured product, boneless-skinless breast, regular pack, had an average price exactly the same in 2011 as in 2010, that is, $2.81/per pound. For the top six items the un-weighted, combined price in 2011 averaged only 1.4 percent higher than in 2010. Chicken continued to be a real food shopper’s bargain in 2011 if the consumer took advantage of the price featured products.
It should be noted that, although the third most popular featured product–fried chicken, 8-piece, mixed–appeared to have slipped in ad share percentage in 2011, this was not actually the case. In 2011, USDA split fried and baked chicken into two separate categories. The 2010 ranking was based on a combination of the two, while the 2011 ranking was based only on the fried. So, even though USDA only included fried in 2011, it maintained its ranking. However, when the ad share in 2011 is combined for fried and baked, this aggregated category leapfrogs to the top spot with 10.45 percent. Thus, the re-combined two items make the fried-baked chicken category the most advertised chicken item in 2011. In this scenario, regular pack boneless-skinless breasts drops to the second top spot with 10.03 percent and small rotisserie chickens to the third most price featured item with ad frequency of 7.79 percent.
Supermarkets provided increased attention for the leg meat parts (drumsticks, thighs, leg quarters, and similar) by featuring family-pack sizes in 2011 compared with small packs. Yet, at the same time, all leg meat items experienced higher average sale pricing. Leg quarters, tray pack, for example, the eighth most featured chicken part in 2011, gained one-percentage point in the frequency of price features from 3.77 percent in 2010 to 4.78 percent in 2011 and had an average price of 92 cents per pound, up 6 cents from the 86 cents per pound in 2010.
Boneless-skinless thighs, value pack, had the most dramatic increase in price with $2.34 per pound in 2011, up 31 cents from the $2.03 per pound in the previous year. On the other hand, whole wings, a very popular part of the chicken, and in better supply in 2011, was the 14th most frequently featured part in 2011 up from the 19th position in 2010. Unlike leg meat items, the featured price for wings declined from $1.99 per pound in 2010 to $1.90 per pound in 2011.
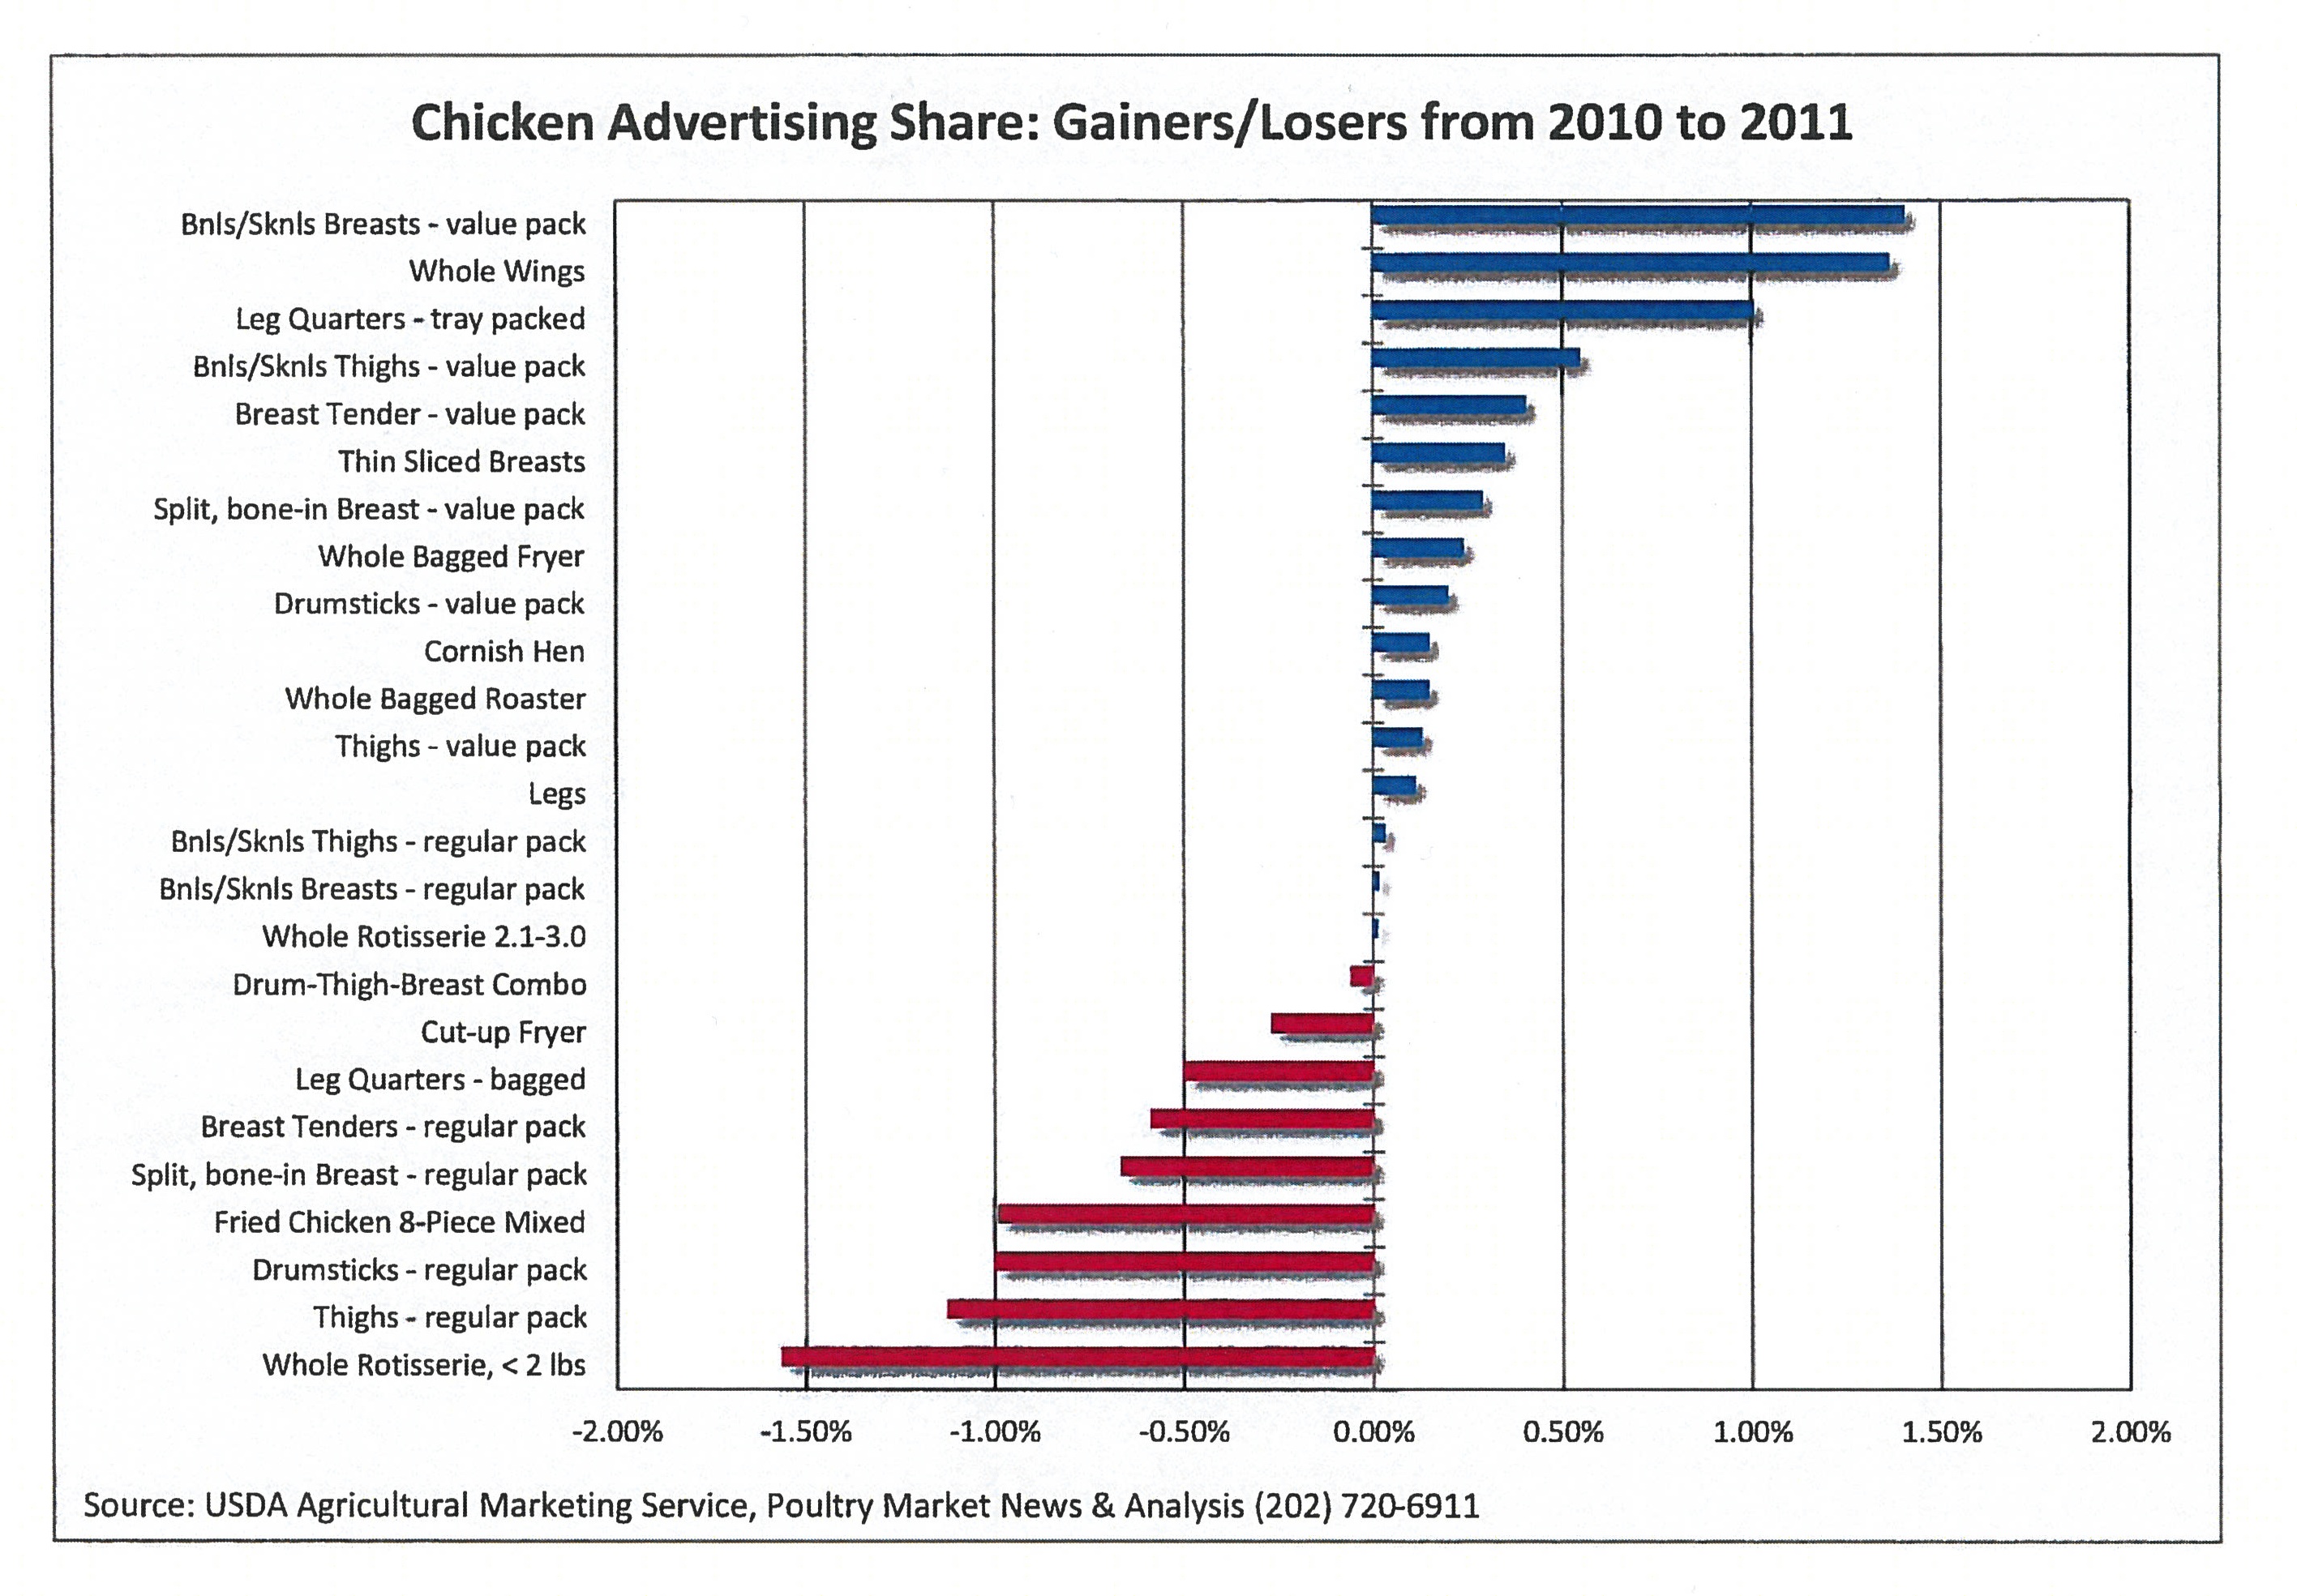
Chicken items gaining the most price featured activity in 2011 were breasts, boneless-skinless, value pack, up 1.40 percentage points; whole wings, up 1.36 percentage points; and leg quarters, tray packed, up 1.01 percentage points.
Supermarkets increasingly discovered in 2011 that a lower advertised feature price may not be the best way to attract more food shopper interest in a particular chicken item. There was a significant increase in the frequency of “no price” sales incentives or features, such as “by one/get one,” “40 percent off all chicken purchases,” and similar non-price advertisements. In 2011 “no price” sales features accounted for 20.65 percent of all promotions for chicken, up more than 4.5 percentage points from the 16.09 percentage share in 2010.
More information and data, including all 61 chicken items covered in USDA’s advertised features report and a breakout of the data for the six regions of the United States can be found at www.ams.usda.gov/pymarketnews, look for “USDA Weekly Retail Chicken Feature Activity Report.”
To view the ranking of the top 25 chicken items for 2009, 2010, and 2011, please click on the link Top 25 Ranking of Chicken Cuts.
The following graph ranks the top 25 chicken items for 2011 compared with 2010.